Introduction
In my last article, the introduction of W.E.I.S.E., I introduced the process for creating the calculation of the expectation of winning, based on historic results with identical combinations of discipline, gender, race lap, the cumulative number of misses and cumulative ski time rank. After further developing the WEISE, this article demonstrates some practical uses of this Win Expectancy Index (WEI).
As a quick reminder, the interactive WEI dashboard can be found here and looks like this (with lap 3 selected):
 Win Expectancy Index example
A female (W) athlete entering lap three of a SPrint race with 1 miss and ranked #3 in ski time, has a 20% chance of winning the race.
Examples of practical uses of the Win Expectancy Index
A tool like the Win Expectancy Index only makes sense if there is actual value in using it. Personally, I think it is very interesting to just look at the index, but I can imagine there are not too many people who share that passion for biathlon, data and data visualization. Below are some practical examples of how the Win Expectancy Index can be used to analyze athletes and races.
Athletes
Final lap Win Expectancy versus actual result
The conversion rate of opportunity to wins. For example, Elvira Oeberg’s conversion rate for races in which her Win Expectancy on the last lap was 33% or higher, was 60% (she won 3 of the 5 races).
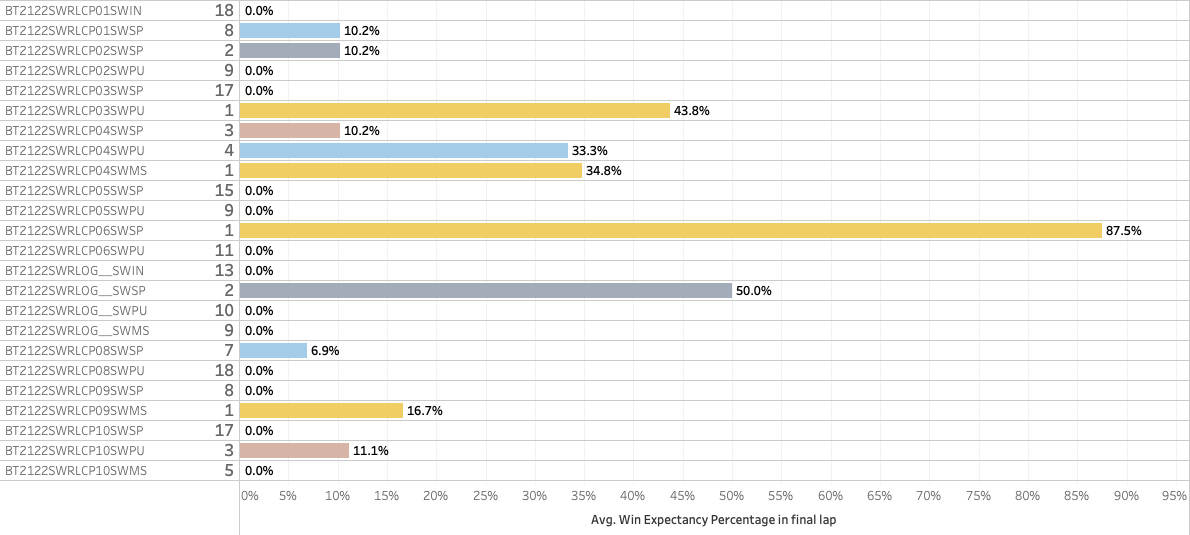 Elvira race results in the 2021-22 season and Win Expectancy in the last lap of the race
Seasonal trend of average Win Expectancy per race for the final lap
This allows us to look at an athlete’s performance without the influence of the actual race results
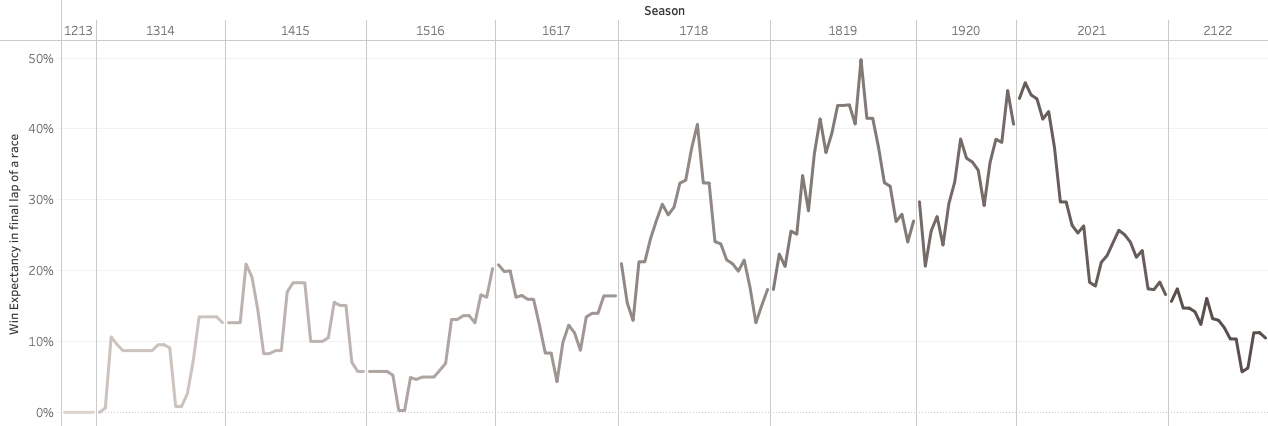 The trend of JT Boe’s Win Expectancy in the final lap of every race
Average Win Expectancy per lap per discipline
Provides insight into a racer’s ability to balance their races well, and still perform well right to the final lap of a race
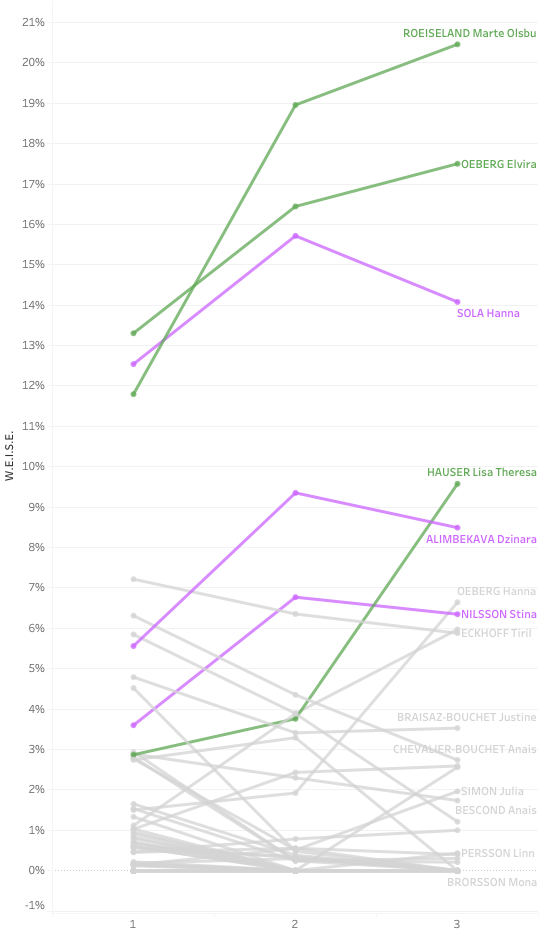 Looking at average Win Expectancy development per lap per athlete for sprint races
In this example, we are looking at all sprint races for women in the 2021-22 season. We then average each athlete’s Win Expectancy per lap. From this, we can see that for athletes like Roeiseland, Elvira Oeberg and Hauser the Win Expectancy increases towards the end of the race. On average, Sola, Alimbekava and Nilsson’s Win Expectancy declines in the last lap.
This gives athletes and coaches a tool to further analyse data at an individual race level to see if there is an issue or potential for improvement.
Races
Win Expectancy per race
How does the Win Expectancy change over the course of the race, and how did the eventual winner develop during the race?
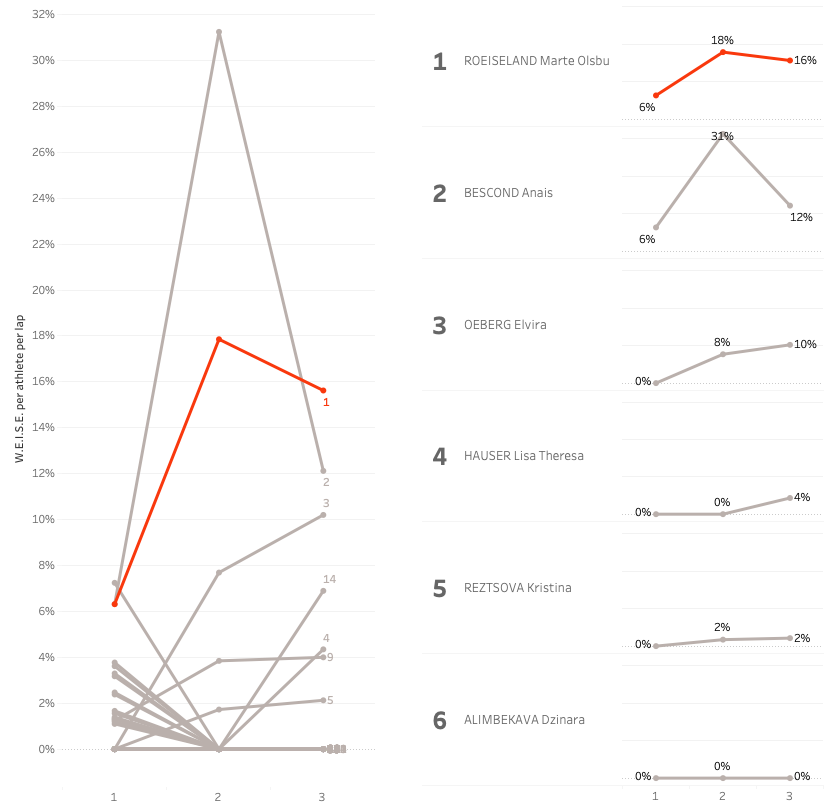 Win Expectancy for athletes in the Women’s Sprint during World Cup 8 of the 2021-22 season
The trend of Win Expectancy per miss as ski rank increases
Here we can see that for athletes in the top-10 for ski rank, the difference in WE between 0 (dark green) or 1 (light green) miss is fairly consistent
 Win Expectancy for all athletes in lap five of all five-lap-races with either
one (light green) or zero (dark green) misses as their race rank increases
The trend of Win Expectancy per ski rank (group) as misses increase
We can see here that the WE when skiing top-5 with one miss (~43%) is lower than when skiing top-10 with 0 misses (~49%)
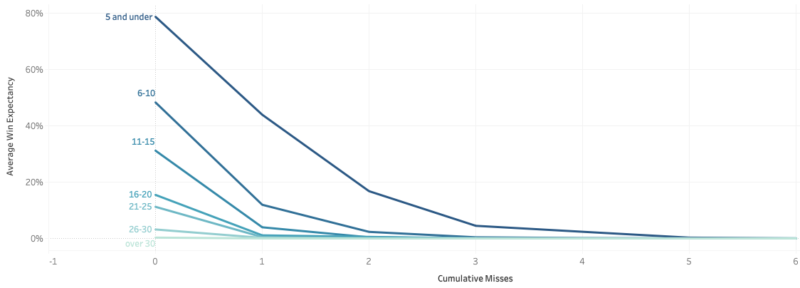 Win Expectancy for all athletes in lap five of all five-lap-races with a ski rank as indicated by the labels as their race misses increase
Using Win Expectancy data to indicate some of the more exciting races
For biathlon viewers and fans, we can look at races where the highest value for Win Expectation (all athletes) during the race was 20% or less (a close pack). And within that group, the number of athletes that had that highest value of WE at some point during the race. If those numbers are 2 or more in sprint races or 4 or more in all other races, we then look at the final rank of the athlete(s) with the highest WE. If that was 10 or better we highlight the races with a pink star:
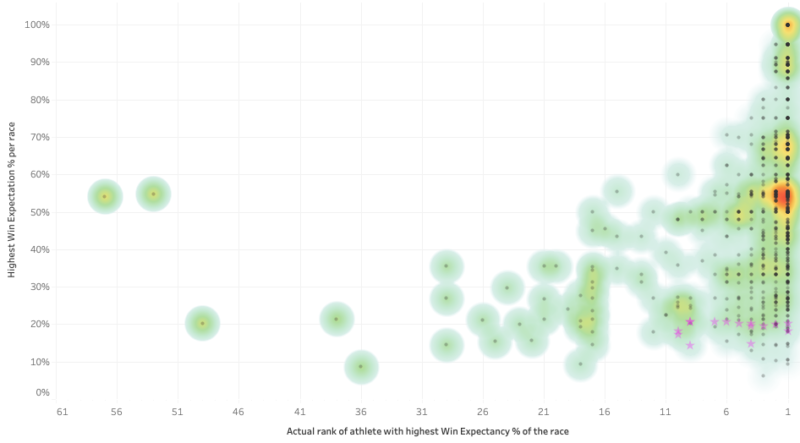
Based on this logic, the Women’s Sprint of World Cup 7 in the 2002-03 season would be interesting to watch (the highest WE of the race was only 14%, three athletes had that WE during the race and the highest rank of those three athletes was 9th). Or more recently, rewatch the 2019-20 World Cup 8 Women’s Pursuit (15%, 5 and #4).
Conclusion and further development
In the first article on the Win Expectancy Index based on Statistical Information, I mostly focused on explaining the underlying data, processes and models, and the concept for the index itself. This article dove into the application of the index by showing some examples of how it can provide value in analyzing the performances of athletes related to historic results with the same variables. I hope that this gives a better understanding of the concept of the WEI, and highlights its potential for performance analysis and athlete improvement based on a different, data-driven, view of biathlon performance.
Thoughts or comments? You can find me on Twitter, or email me on the podcast Gmail account: PenaltyLoopPodcast
About Post Author
Proud dad&husband; analyst & visualization specialist (Tableau, SQL & R); creator of Biathlon Analytics; blog poster on realbiathlon.com; passionate about biathlon, cross country skiing and canoeing